This tutorial shows how to obtain magnitude response and phase response of filter and also shows how to obtain the transient response of the filter using orcad capture. Filters is important component in any RF system and tutorial helps to know the frequency, phase and transient behavior of filters.
We suppose that the transfer function of a filter such as Butterworth filter in given and it has the following transfer function:
\[H(s)=\frac{100}{s^{2}+14.14s+100}\]
and suppose we want to calculate the frequency and the phase response of this transfer function H(s).
First we draw the schematic for the circuit with the Laplace part from the ABM library as the filter. This part allows us to define the above transfer function equation by right clicking the Laplace part and entering the denominator and numerator into it's properties window. The input to the filter is a VDC source obtained from the source library. This is shown in the figure below-
The above picture shows both the schematics and the Laplace part from the ABM library.
After the schematic is completed the next step is to set the simulation. To do this we go to Pspice > New Simulation Profile in the toolbar.
Magnitude Response
To obtain the frequency response of the filter we choose AC Sweep/ Noise in the Analysis Type, logarithm as the AC sweep type and run the simulation from the start frequency of 0.1Hz to 10,000Hz and also choose 1001 as the points/decade as shown in figure below-
Now to get the magnitude in dB of the filter frequency response we place a voltage marker on the output of the Filter. To do this we select the marker as shown-
And place on the output of the filter as shown-
Clicking on the run button we obtain the following frequency magnitude response of the above filter-
We can easily obtain the -3dB point using the cursor. If the cursor tools is not selectable on the toolbar go to Trace > Cursor > Display and the cursor toolbar will be selectable. Now place the cursor on the - 3dB point as shown-
From the same graph we can see that the -3dB is obtained at the frequency of 1.59Hz.
Phase Response
Now to obtain the Phase response we place a voltage phase marker at the output of the filter to obtain the phase response as shown-
Transient Response
In order to get the transient response we have to do two things- first replace the VDC source with a new unit step source and change the simulation type to transient.
We can delete the pervious VDC source and add the VPWL(Voltage Piecewise Linear) part from the source library. Having place the VWPL part, right click the part and enter the three time instants and corresponding voltages to those times. That is when T1=0sec, V1= 0V, when T2= 10ns then V2=1V and at time T3=10s the voltage is V3=1V. This is illustrated below-
Now to set the simulation type to transient go to Pspice > Edit Simulation Profile, select analysis type as Time Domain(Transient), Run to time as 6s and maximum step size as 1m (for 1millisecond).
Place two voltage marker, one at the input and the another at the output of the filter as shown-
Click Run to run the simulation and we get the following transient response graph-
From this graph many result can be obtained such as max overshoot, rise time, fall time etc. One of the result is that the maximum magnitude response is 1.0421V obtained at 0.427ms. This calculation and result is obtained by placing a cursor at the maximum of the curve as illustrated below-
We suppose that the transfer function of a filter such as Butterworth filter in given and it has the following transfer function:
\[H(s)=\frac{100}{s^{2}+14.14s+100}\]
and suppose we want to calculate the frequency and the phase response of this transfer function H(s).
First we draw the schematic for the circuit with the Laplace part from the ABM library as the filter. This part allows us to define the above transfer function equation by right clicking the Laplace part and entering the denominator and numerator into it's properties window. The input to the filter is a VDC source obtained from the source library. This is shown in the figure below-
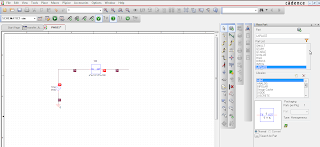 |
| Fig: Schematics showing Filter Transfer Function |
After the schematic is completed the next step is to set the simulation. To do this we go to Pspice > New Simulation Profile in the toolbar.
Magnitude Response
To obtain the frequency response of the filter we choose AC Sweep/ Noise in the Analysis Type, logarithm as the AC sweep type and run the simulation from the start frequency of 0.1Hz to 10,000Hz and also choose 1001 as the points/decade as shown in figure below-
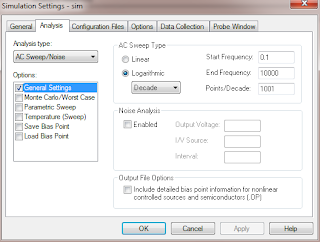 |
| Fig: Simulation setting |
And place on the output of the filter as shown-
Clicking on the run button we obtain the following frequency magnitude response of the above filter-
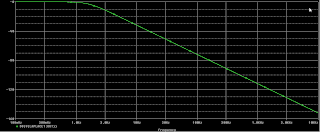 |
| Fig: Magnitude response of Filter |
We can easily obtain the -3dB point using the cursor. If the cursor tools is not selectable on the toolbar go to Trace > Cursor > Display and the cursor toolbar will be selectable. Now place the cursor on the - 3dB point as shown-
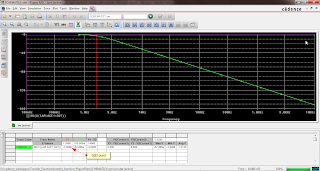 | ||
| Fig: obtaining-3dB point using cursor |
From the same graph we can see that the -3dB is obtained at the frequency of 1.59Hz.
Phase Response
Now to obtain the Phase response we place a voltage phase marker at the output of the filter to obtain the phase response as shown-
 |
| Fig: Phase response of the filter |
Transient Response
In order to get the transient response we have to do two things- first replace the VDC source with a new unit step source and change the simulation type to transient.
We can delete the pervious VDC source and add the VPWL(Voltage Piecewise Linear) part from the source library. Having place the VWPL part, right click the part and enter the three time instants and corresponding voltages to those times. That is when T1=0sec, V1= 0V, when T2= 10ns then V2=1V and at time T3=10s the voltage is V3=1V. This is illustrated below-
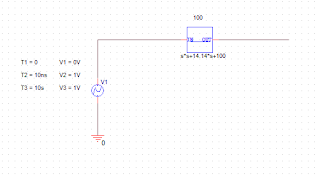 |
| Fig: Adding Unit Step signal |
Now to set the simulation type to transient go to Pspice > Edit Simulation Profile, select analysis type as Time Domain(Transient), Run to time as 6s and maximum step size as 1m (for 1millisecond).
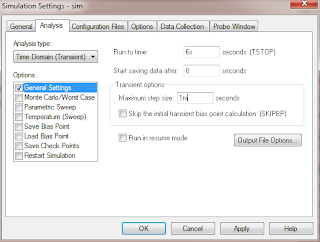 |
| Fig: Simulation setting for Transient Response |
Place two voltage marker, one at the input and the another at the output of the filter as shown-
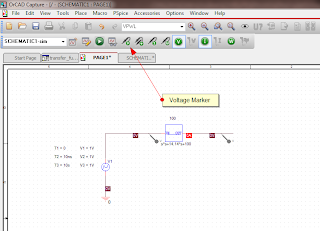 |
| Fig: Schematic for simulation for transient response |
Click Run to run the simulation and we get the following transient response graph-
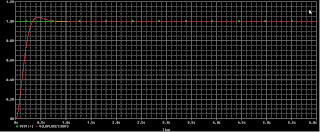 |
| Fig: Transient response of the Filter |
From this graph many result can be obtained such as max overshoot, rise time, fall time etc. One of the result is that the maximum magnitude response is 1.0421V obtained at 0.427ms. This calculation and result is obtained by placing a cursor at the maximum of the curve as illustrated below-
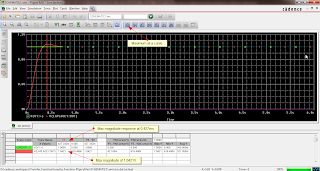 |
| Fig: Maximum Magnitude Response |


Tidak ada komentar:
Posting Komentar