In this article
Class C Power Amplifier circuit is designed stimulate using orcad capture. LC oscillator is designed to oscillate at 25kHz and then input signal frequency and amplitude is varied to get maximum output voltage.
Class C Power Amplifier Schematic
Below is a schematic diagram of a Class C Power Amplifier.
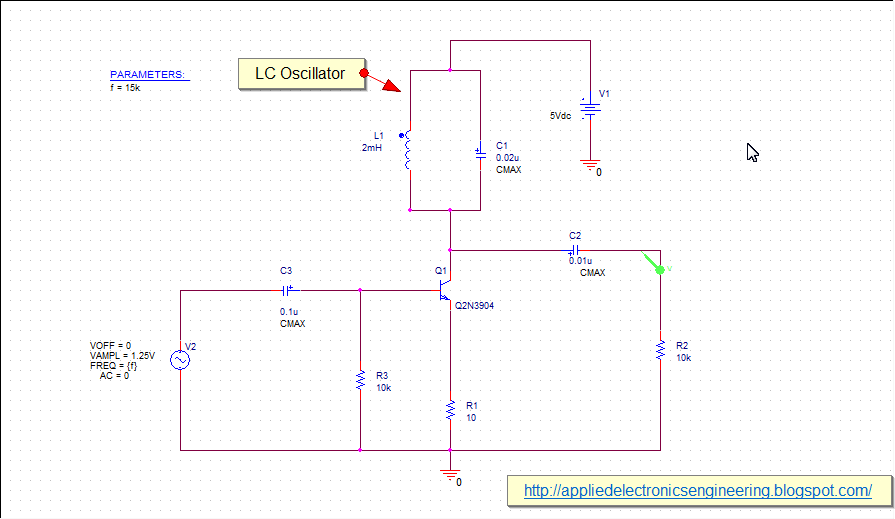 |
| Fig: class C power amplifier circuit |
In the above schematic, an input sinusoid signal is applied which has voltage magnitude of 1.25V. The frequency(f) is varied from 15kHz to 30kHz using the parameter sweep tool available in orcad capture. This signal is fed into the
class C power amplifier that is made by transistor Q2N3904, L1 and C1 which makes up the LC tuned oscillator. The resistors R3 and R1 are biasing resistors required to bias the transistors(see
transistor biasing tutorial). The resistor R2 is a load resistor. The capacitors C3 and C2 are coupling capacitors that blocks dc signals and allows ac signal to pass. This circuit is run by 5V supply.
We know that the frequency of oscillation of the LC oscillator is 25kHz derived from the LC oscillator frequency formula-
\[f=\frac{1}{2\pi\sqrt{LC}}\]
Substituting 2mH for inductor and 0.02microF for capacitor gives 25kHz.
Class C Power Amplifier Simulation
Although we know the frequency of the oscillator we want to know what the frequency of the input signal is at which the magnitude of the output voltage is maximum given that the magnitude of the input signal voltage is 1.25V. By varying the frequency of the input signal we can get information about the frequency at which the output voltage magnitude is maximum.
To do this we vary the frequency of the input signal using the parameter sweep tool which is located in the Special library. Then we set up the simulation setting with Transient simulation of run time of 1ms and step size is 10us. Also we set up parameter sweep with f as global parameter, linear sweep type from 15kHz to 30kHz and increment of 1kHz. This simulation setting is shown below-
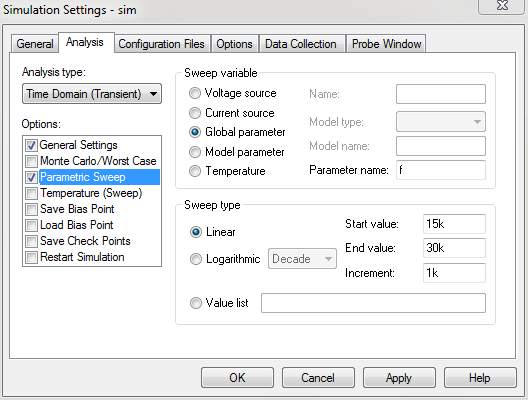 |
| Fig: Simulation setting parametric sweep |
We put the voltage probe tool at the output as shown in the schematic and run the simulation to get its waveform-
 |
| Fig: Output Voltage waveforms at different input frequencies |
This waveform shows output voltage waveform for all frequency from 15kHz to 30kHz.
Using the FFT tool available in orcad capture we get the following FT-
 |
| Fig: Output signal waveform Fourier transform |
To zoom in we can use the zoom area tool available in the toolbar-
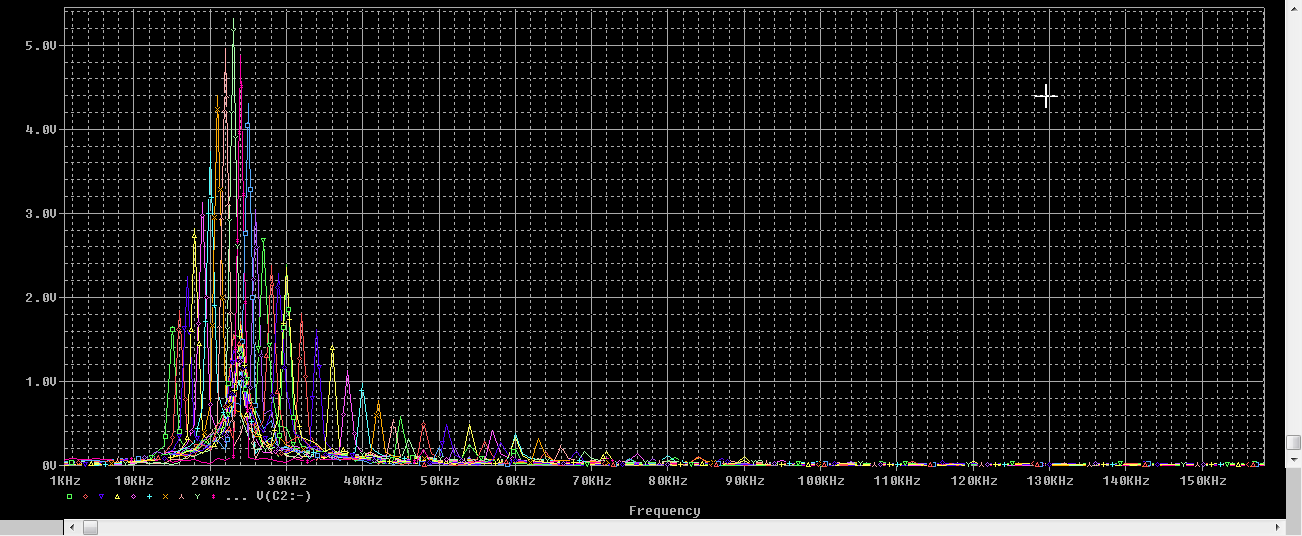 |
| Fig: Fourier transform of Output signal waveform |
 |
| Fig: Fourier transform of Output signal waveform |
From this final FT graph we can clearly see the frequency at which the magnitude of the output signal is maximum. The green at the center has greatest peak and right clicking on it and selecting Trace Information gives us the its frequency information. This is shown below-
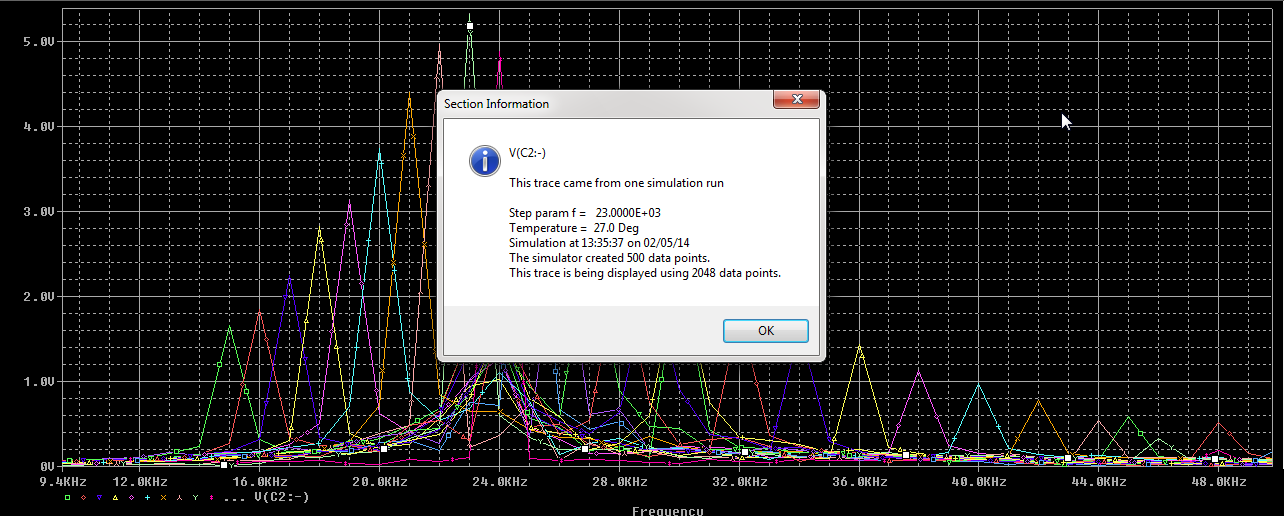 |
| Fig: Trace Information from Fourier Transform |
This information shows that the frequency of this trace is 23kHz.
We can now change the input signal frequency to this 23kHz.
Now we can similarly vary the amplitude of the input signal using the parameter sweep tool. The amplitude is varied from 0.5V to 3V as shown-
 |
| Fig: Class C Power Amplifier circuit with Voltage Parameter Sweep |
and the voltage variation sweep settings-
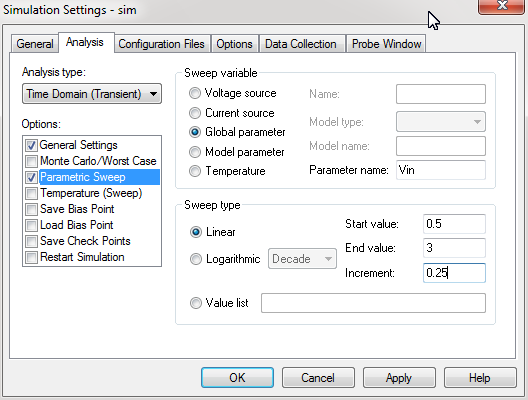 |
| Fig: Simulation setting for voltage parameter sweep |
The output waveform with varying input voltage amplitude is shown below-
 |
| Fig: Output Voltage waveform with voltage parametric sweep |
The Fourier Transform is shown below-
 |
| Fig: Fourier Transform of output voltage |
Using the Zoom Area Tool in the toolbar-
 |
| Fig: Zoomed Fourier Transform of output voltage |
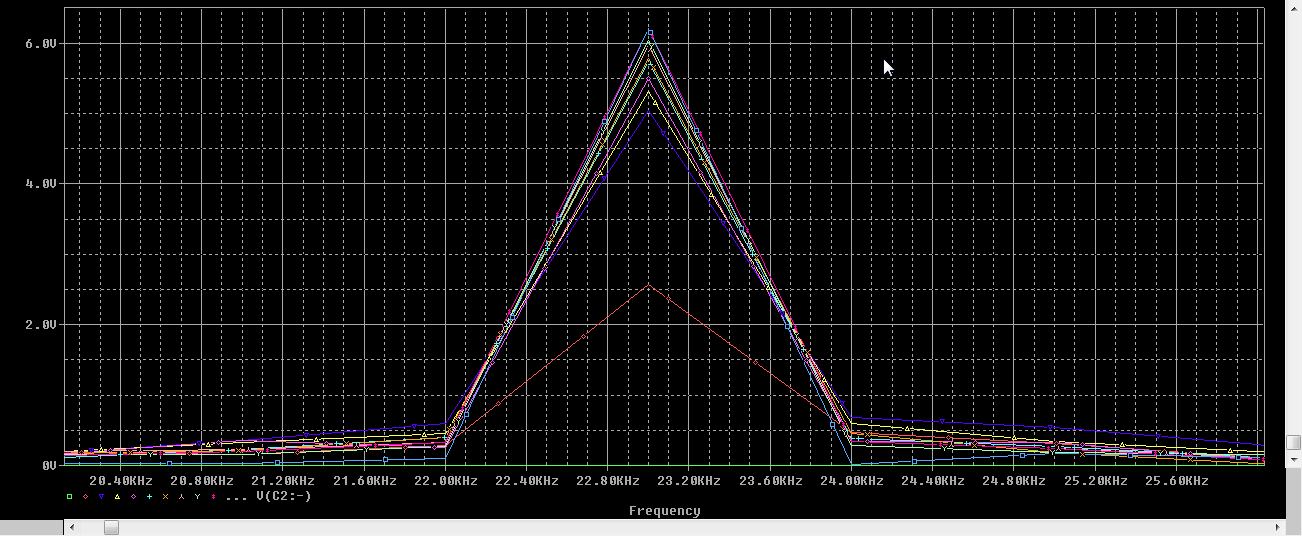 |
| Fig: Zoomed Fourier Transform of output voltage |
Zooming into the peak and selecting the peak signal and right clicking to get its trace information gives-
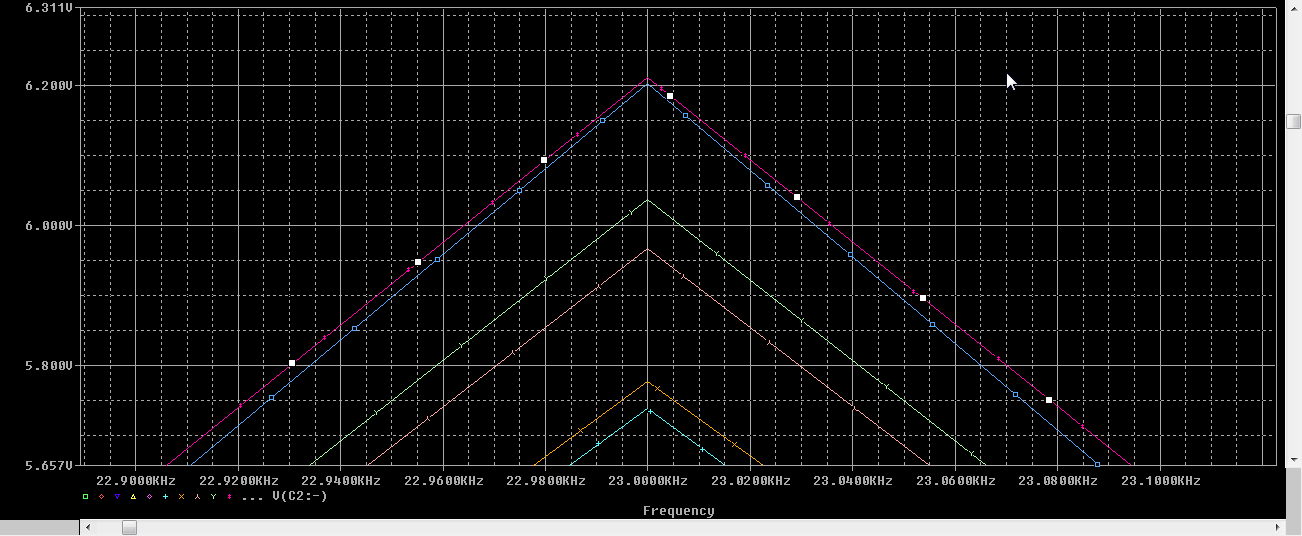 |
| Fig: Zoomed Fourier Transform of output voltage |
 |
| Fig: Output Voltage trace information |
This shows that the magnitude of the input voltage at which the output voltage is maximum is 2.75V.
Changing the input voltage to 2.75V, removing the parameter sweep tool the final class C amplifier circuit is shown below-
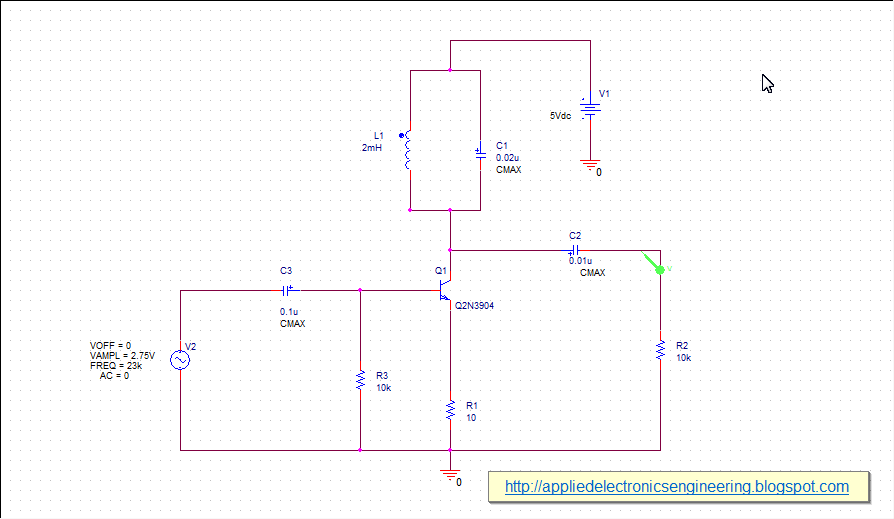 |
| Fig: Final Class C Power Amplifier |
Removing the parameter sweep in the simulation setup and running the final circuit for 2ms gives the following output signal waveform-
 |
| Fig: Final Output voltage waveform |
And the Fourier Transform gives-
 |
| Fig: Final Output voltage waveform |
This shows that the maximum output voltage is around 6V.


Tidak ada komentar:
Posting Komentar