Last time we discussed about the power spectral density of NRZ and RZ On-Off signal. This article is a continuation of power spectral densities of line coders and here PSD of NRZ and RZ polar signal will be plotted with Matlab.
We start with the definition of NRZ and RZ polar signal with mathematical formula and then plot the PSD of those signals.
For definition see Energy Spectral Density and Power Spectral Density blog post.
NRZ Polar Signal
A Polar signal is one in which binary one is represented by a +ve pulse and binary zero is represented by a -ve pulse. A NRZ(Non-Return-Zero) polar signal is one in which the bits(i.e the +ve and -ve pulse) has a full width duration called the bit duration or pulse duration.
An example of a binary sequence 100 in NRZ polar form is shown below-
Now we wish to calculate the power spectral density of such signal. That is looking at the figure below we wish to calculate the power spectral density of the output signal y(t).
In order to calculate Sy(w) and to do this we need Sx(w) and P(w), see equation below-
\[S_y(w)=|P(w)|^{2}S_x(w)\space\space\space\space\space\space---->(1)\]
For a NRZ rectangular polar signals as shown above the Fourier Transform P(w) of such signal is-
\[P(w)=T_b*sinc(\frac{w*T_b}{2})\space\space\space\space\space\space\space\space\space\space\space\space------>(2)\]
The derivation of final PSD Sx(w) of input signal x(t) is lengthy and we provide only the final result. The PSD Sx(w) is-
\[S_x(w)=\frac{1}{T_b}(R_0+2\sum_{n=1}^\infty R_ncos(nwT_b))\]
Determining the autocorrelation we find that Ro=1 and Rn=0 and the above equation simplifies to-
\[S_x(w)=\frac{1}{T_b}\space\space\space\space\space\space\space\space\space\space\space------>(3)\]
Using the equation (2) and (3) result in equation (1), the PSD Sy(w) is-
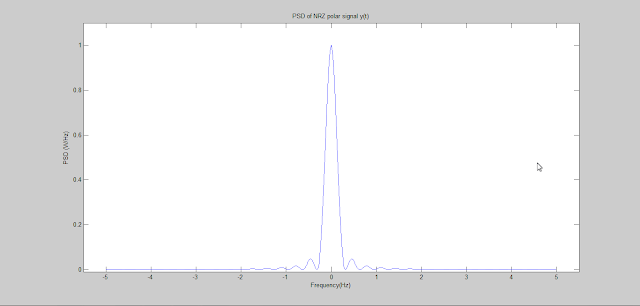
\[S_y(w)=T_b*sinc^{2}(\frac{{w*T_b}}{2})\space\space\space\space\space\space\space\space\space\space\space------>(4)\]
The matlab code to generate this PSD is below-
% Generates PSD of NRZ polar signal
clear on
clc
Tb=1;
Rb=1/Tb;
faxis=-5*Rb:Rb/100:5*Rb;
w=2*pi*faxis;
Sy=Tb*(sinc((w*Tb)/2)).^2
plot(faxis,Sy)
xlabel('Frequency(Hz)')
ylabel('PSD (W/Hz)')
title('PSD of NRZ polar signal y(t)')
axis([-5.5 5.5 -0.01 1.1])
The plot is shown below-
RZ Polar Signal
A RZ polar signal is one in which the pulses representing the binary bits 1 and 0 has a half width bit duration or pulse duration. This is illustrated in the picture below-
Again visualizing the input/output PSD relation as shown in picture above and the equation (1) we require the Px(w) and Sx(w) for this RZ polar signal.
The Fourier transform of RZ polar pulse is-
\[P(w)=\frac{T_b}{2}*sinc(\frac{w*T_b}{4})\space\space\space\space\space\space\space\space\space\space\space\space------>(5)\]
And the PSD of the input signal is-
\[S_x(w)=\frac{1}{T_b}\space\space\space\space\space\space\space\space\space\space\space------>(6)\]
Thus using equation (5) and (6) in equation (1) we get-
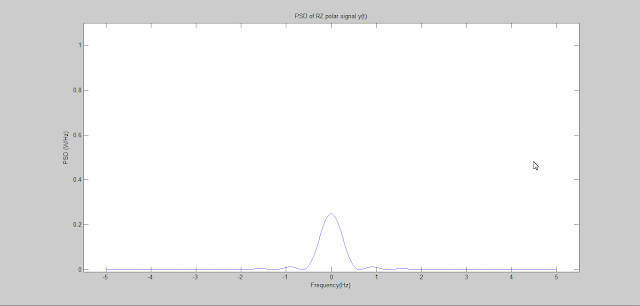
\[S_y(w)=\frac{T_b}{4}*sinc^{2}(\frac{{w*T_b}}{4})\space\space\space\space\space\space\space\space\space\space\space------>(7)\]
The matlab for this PSD is below-
% Generates PSD of RZ polar signal
clear on
clc
Tb=1;
Rb=1/Tb;
faxis=-5*Rb:Rb/100:5*Rb;
w=2*pi*faxis;
Sy=(Tb/4)*(sinc((w*Tb)/4)).^2
plot(faxis,Sy)
xlabel('Frequency(Hz)')
ylabel('PSD (W/Hz)')
title('PSD of RZ polar signal y(t)')
axis([-5.5 5.5 -0.01 1.1])
The plot is shown below-
See more Matlab Tutorials
We start with the definition of NRZ and RZ polar signal with mathematical formula and then plot the PSD of those signals.
For definition see Energy Spectral Density and Power Spectral Density blog post.
NRZ Polar Signal
A Polar signal is one in which binary one is represented by a +ve pulse and binary zero is represented by a -ve pulse. A NRZ(Non-Return-Zero) polar signal is one in which the bits(i.e the +ve and -ve pulse) has a full width duration called the bit duration or pulse duration.
An example of a binary sequence 100 in NRZ polar form is shown below-
 |
| Figure: example of polar NRZ sequence |
 |
| Figure: PSD input output relation |
\[S_y(w)=|P(w)|^{2}S_x(w)\space\space\space\space\space\space---->(1)\]
For a NRZ rectangular polar signals as shown above the Fourier Transform P(w) of such signal is-
\[P(w)=T_b*sinc(\frac{w*T_b}{2})\space\space\space\space\space\space\space\space\space\space\space\space------>(2)\]
The derivation of final PSD Sx(w) of input signal x(t) is lengthy and we provide only the final result. The PSD Sx(w) is-
\[S_x(w)=\frac{1}{T_b}(R_0+2\sum_{n=1}^\infty R_ncos(nwT_b))\]
Determining the autocorrelation we find that Ro=1 and Rn=0 and the above equation simplifies to-
\[S_x(w)=\frac{1}{T_b}\space\space\space\space\space\space\space\space\space\space\space------>(3)\]
Using the equation (2) and (3) result in equation (1), the PSD Sy(w) is-
\[S_y(w)=T_b*sinc^{2}(\frac{{w*T_b}}{2})\space\space\space\space\space\space\space\space\space\space\space------>(4)\]
The matlab code to generate this PSD is below-
% Generates PSD of NRZ polar signal
clear on
clc
Tb=1;
Rb=1/Tb;
faxis=-5*Rb:Rb/100:5*Rb;
w=2*pi*faxis;
Sy=Tb*(sinc((w*Tb)/2)).^2
plot(faxis,Sy)
xlabel('Frequency(Hz)')
ylabel('PSD (W/Hz)')
title('PSD of NRZ polar signal y(t)')
axis([-5.5 5.5 -0.01 1.1])
The plot is shown below-
 |
| Figure: Power spectral density of NRZ polar signal |
A RZ polar signal is one in which the pulses representing the binary bits 1 and 0 has a half width bit duration or pulse duration. This is illustrated in the picture below-
 |
| Figure: RZ polar signal |
The Fourier transform of RZ polar pulse is-
\[P(w)=\frac{T_b}{2}*sinc(\frac{w*T_b}{4})\space\space\space\space\space\space\space\space\space\space\space\space------>(5)\]
And the PSD of the input signal is-
\[S_x(w)=\frac{1}{T_b}\space\space\space\space\space\space\space\space\space\space\space------>(6)\]
Thus using equation (5) and (6) in equation (1) we get-
\[S_y(w)=\frac{T_b}{4}*sinc^{2}(\frac{{w*T_b}}{4})\space\space\space\space\space\space\space\space\space\space\space------>(7)\]
The matlab for this PSD is below-
% Generates PSD of RZ polar signal
clear on
clc
Tb=1;
Rb=1/Tb;
faxis=-5*Rb:Rb/100:5*Rb;
w=2*pi*faxis;
Sy=(Tb/4)*(sinc((w*Tb)/4)).^2
plot(faxis,Sy)
xlabel('Frequency(Hz)')
ylabel('PSD (W/Hz)')
title('PSD of RZ polar signal y(t)')
axis([-5.5 5.5 -0.01 1.1])
The plot is shown below-
 |
| Figure: Power Spectral Density of RZ polar signal |
Tidak ada komentar:
Posting Komentar